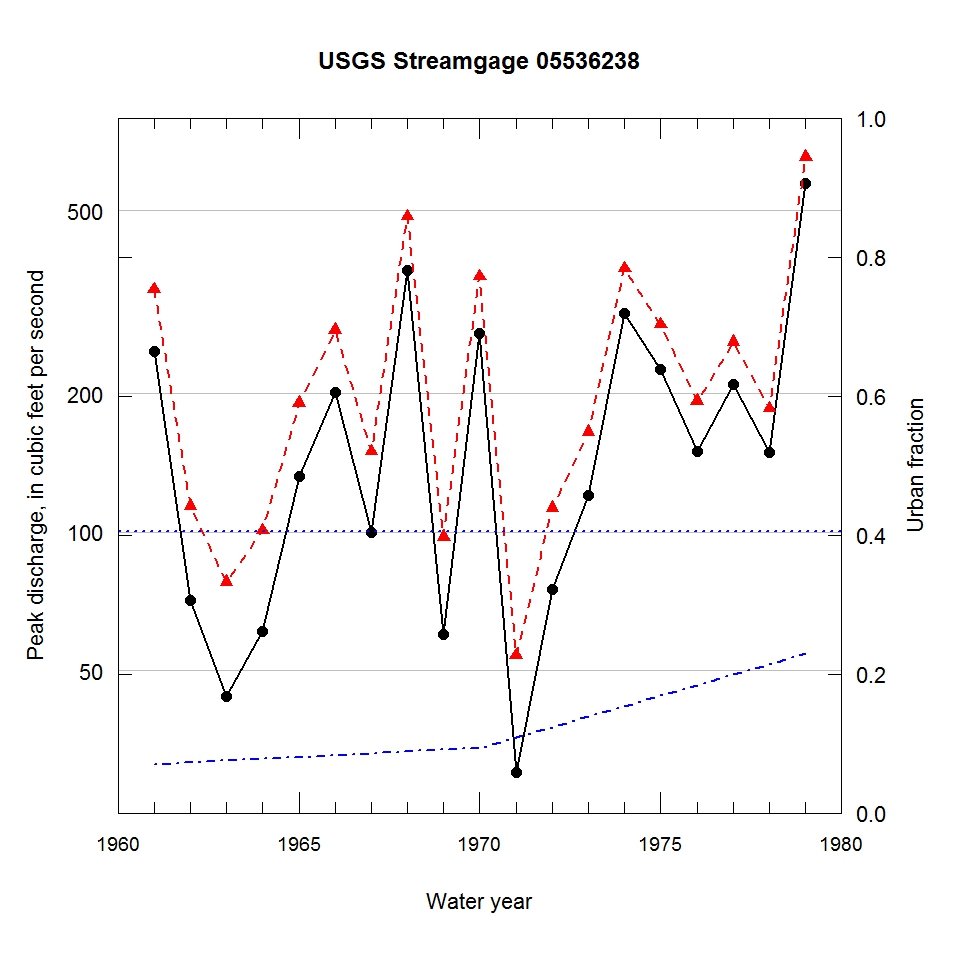
Observed and urbanization-adjusted annual maximum peak discharge and associated urban fraction and precipitation values at USGS streamgage:
05536238 BUTTERFIELD CREEK NEAR LINCOLN ESTATES, IL


| Water year | Segment | Discharge code | Cumulative reservoir storage (acre-feet) | Urban fraction | Precipitation (inches) | Observed peak discharge (ft3/s) | Adjusted peak discharge (ft3/s) | Exceedance probability |
| 1961 | 1 | -- | 0 | 0.070 | 1.619 | 248 | 337 | 0.151 |
| 1962 | 1 | -- | 0 | 0.073 | 0.246 | 71 | 114 | 0.848 |
| 1963 | 1 | 4B | 0 | 0.075 | 0.246 | 44 | 78 | 0.940 |
| 1964 | 1 | -- | 0 | 0.078 | 0.867 | 61 | 101 | 0.890 |
| 1965 | 1 | -- | 0 | 0.081 | 0.948 | 132 | 191 | 0.550 |
| 1966 | 1 | -- | 0 | 0.083 | 1.582 | 201 | 275 | 0.264 |
| 1967 | 1 | -- | 0 | 0.086 | 1.191 | 100 | 150 | 0.723 |
| 1968 | 1 | -- | 0 | 0.088 | 1.491 | 372 | 486 | 0.047 |
| 1969 | 1 | -- | 0 | 0.091 | 0.492 | 60 | 98 | 0.898 |
| 1970 | 1 | -- | 0 | 0.094 | 1.446 | 271 | 360 | 0.124 |
| 1971 | 1 | -- | 0 | 0.109 | 1.028 | 30 | 54 | 0.975 |
| 1972 | 1 | -- | 0 | 0.124 | 1.247 | 75 | 113 | 0.854 |
| 1973 | 1 | -- | 0 | 0.139 | 1.295 | 120 | 165 | 0.657 |
| 1974 | 1 | -- | 0 | 0.154 | 1.145 | 299 | 375 | 0.106 |
| 1975 | 1 | -- | 0 | 0.169 | 1.134 | 226 | 283 | 0.242 |
| 1976 | 1 | -- | 0 | 0.184 | 1.563 | 150 | 193 | 0.542 |
| 1977 | 1 | -- | 0 | 0.199 | 0.752 | 210 | 259 | 0.309 |
| 1978 | 1 | -- | 0 | 0.214 | 1.169 | 149 | 186 | 0.575 |
| 1979 | 1 | -- | 0 | 0.229 | 0.767 | 573 | 654 | 0.018 |

